Evaluating Apple Inc. (AAPL): A Comprehensive Financial and Risk Analysis
An analytical deep-dive into Apple Inc. financials, risk profile, and market performance for institutional advisors.
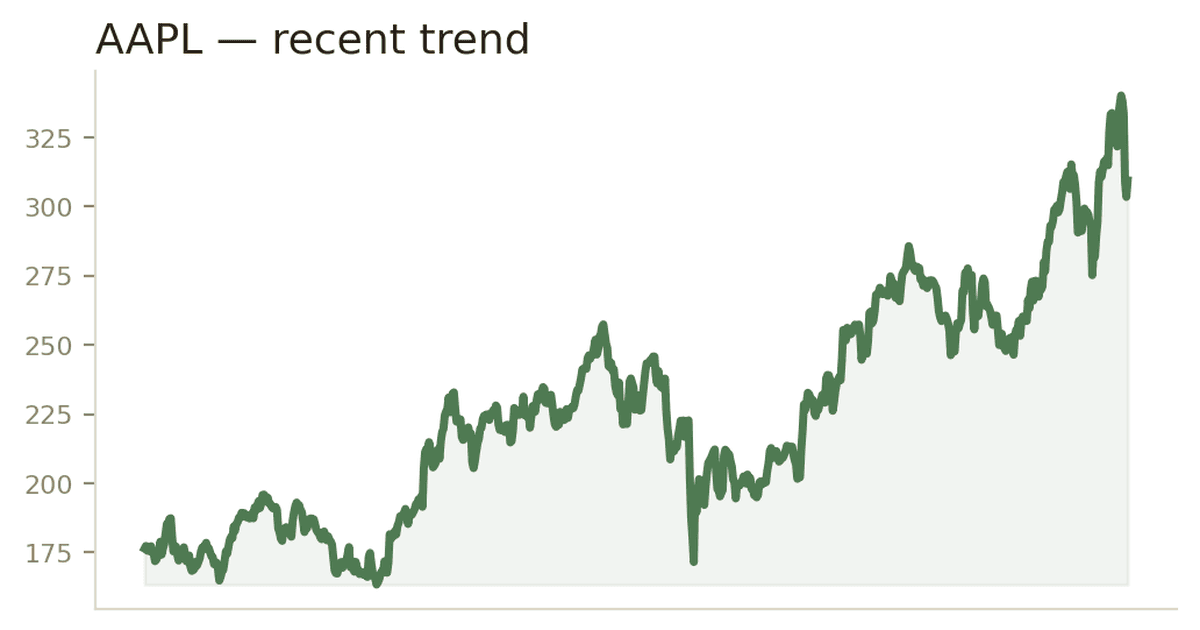

Introduction and Corporate Profile
Apple Inc. (ticker: AAPL, CIK: 0000320193), operating within the electronic computers industry (SIC code 3571) and traded on The Nasdaq Stock Market LLC, represents a cornerstone holding in many institutional and private client portfolios. As advisory practices evaluate white-label platforms like Bright Analyst for client reporting, examining underlying enterprise fundamentals with strict data rigor is paramount. This analysis reviews verified financial metrics, capital allocation structures, and empirical risk characteristics without relying on speculative forecasts.

Income Statement and Revenue Trajectory
Reviewing the income statement over the annual periods ending September 30 provides clear visibility into top-line and bottom-line trends. Net sales demonstrated consistent expansion, moving from $365.82B in 2021 to $394.33B in 2022, $383.29B in 2023, $391.04B in 2024, and reaching $416.16B in 2025.
Cost of sales followed a corresponding trajectory, recorded at $212.98B in 2021, $223.55B in 2022, $214.14B in 2023, $210.35B in 2024, and $220.96B in 2025. This drove gross margin figures of $152.84B in 2021, $170.78B in 2022, $169.15B in 2023, $180.68B in 2024, and $195.20B in 2025.
Operating Expenses and Research Intensity
Research and development expenditure exhibits a steady upward trend reflecting ongoing engineering investments, progressing from $21.91B in 2021 to $26.25B in 2022, $29.92B in 2023, $31.37B in 2024, and $34.55B in 2025. Selling, general, and administrative expenses remained controlled at $21.97B in 2021, $25.09B in 2022, $24.93B in 2023, $26.10B in 2024, and $27.60B in 2025. Total operating expenses reached $43.89B, $51.35B, $54.85B, $57.47B, and $62.15B across the respective five annual periods.
Operating and Net Income Performance
Operating income stood at $108.95B in 2021, $119.44B in 2022, $114.30B in 2023, $123.22B in 2024, and $133.05B in 2025. After accounting for provisions for income taxes of $14.53B in 2021, $19.30B in 2022, $16.74B in 2023, $29.75B in 2024, and $20.72B in 2025, net income was recorded at $94.68B, $99.80B, $97.00B, $93.74B, and $112.01B for the respective years. Diluted earnings per share (EPS) registered at $5.61, $6.11, $6.13, $6.08, and $7.46 across the five-year timeframe.

Balance Sheet Structure and Liquidity Management
The balance sheet as of September 30, 2025, reflects total assets of $359.24B, compared to $364.98B in 2024, $352.58B in 2023, $352.76B in 2022, and $351.00B in 2021. Current assets as of 2025 stood at $147.96B, incorporating cash and cash equivalents of $35.93B, marketable securities of $18.76B, accounts receivable of $39.78B, and inventories of $5.72B.
Non-Current Assets and Liability Composition
Non-current assets totaled $211.28B in 2025, featuring non-current marketable securities of $77.72B and property, plant, and equipment net of $49.83B. On the liabilities side, total current liabilities were $165.63B in 2025, down from $176.39B in 2024. Total non-current liabilities stood at $119.88B in 2025, inclusive of $78.33B in long-term term debt. Total shareholders' equity recovered to $73.73B in 2025 following $56.95B in 2024 and $62.15B in 2023.

Cash Flow Dynamics and Capital Return
Operating cash flows remained robust, generating $104.04B in 2021, $122.15B in 2022, $110.54B in 2023, $118.25B in 2024, and $111.48B in 2025. Investing activities yielded positive cash generation of $15.20B in 2025 and $2.94B in 2024, largely driven by net proceeds from marketable securities transactions offsetting capital expenditures of $12.72B in 2025.
Financing Activities and Share Repurchases
Financing cash flows highlight sustained return of capital to shareholders. Repurchases of common stock absorbed substantial liquidity, totaling $85.97B in 2021, $89.40B in 2022, $77.55B in 2023, $94.95B in 2024, and $90.71B in 2025. Payments for dividends and dividend equivalents remained stable at $14.47B, $14.84B, $15.03B, $15.23B, and $15.42B across the corresponding annual periods. Total dividends paid TTM stand at $1.05 with a trailing dividend yield of 0.3394 based on verified raw dividend data.
Risk Profile and Historical Performance Metrics
Empirical risk metrics evaluated against the benchmark SPY over the sample period indicate an annualized return of 16.77% for AAPL compared to the benchmark's 13.29%. Annualized volatility registered at 24.77%, exceeding the benchmark volatility of 15.76%. The resulting Sharpe ratio stands at 0.68 alongside a Sortino ratio of 1.21. Beta is measured at 1.08 with an alpha of 0.024.
Drawdown Analysis
Historical drawdown analysis identifies a maximum drawdown of -33.36% occurring between December 26, 2024, and April 8, 2025, with a recovery span of 178 days. An earlier significant drawdown of -30.91% occurred between January 3, 2023, and January 5, 2023, spanning 367 days with a 148-day recovery period.
Key takeaways
- Net sales reached $416.16B for the fiscal year ending September 30, 2025, demonstrating top-line expansion.
- Operating income reached $133.05B in 2025, supported by disciplined operating expense management.
- Capital allocation strategy prioritized share repurchases, totaling $90.71B in 2025 alongside $15.42B in dividend payments.
- Risk metrics reflect an annualized volatility of 24.77% and a beta of 1.08 relative to the benchmark.
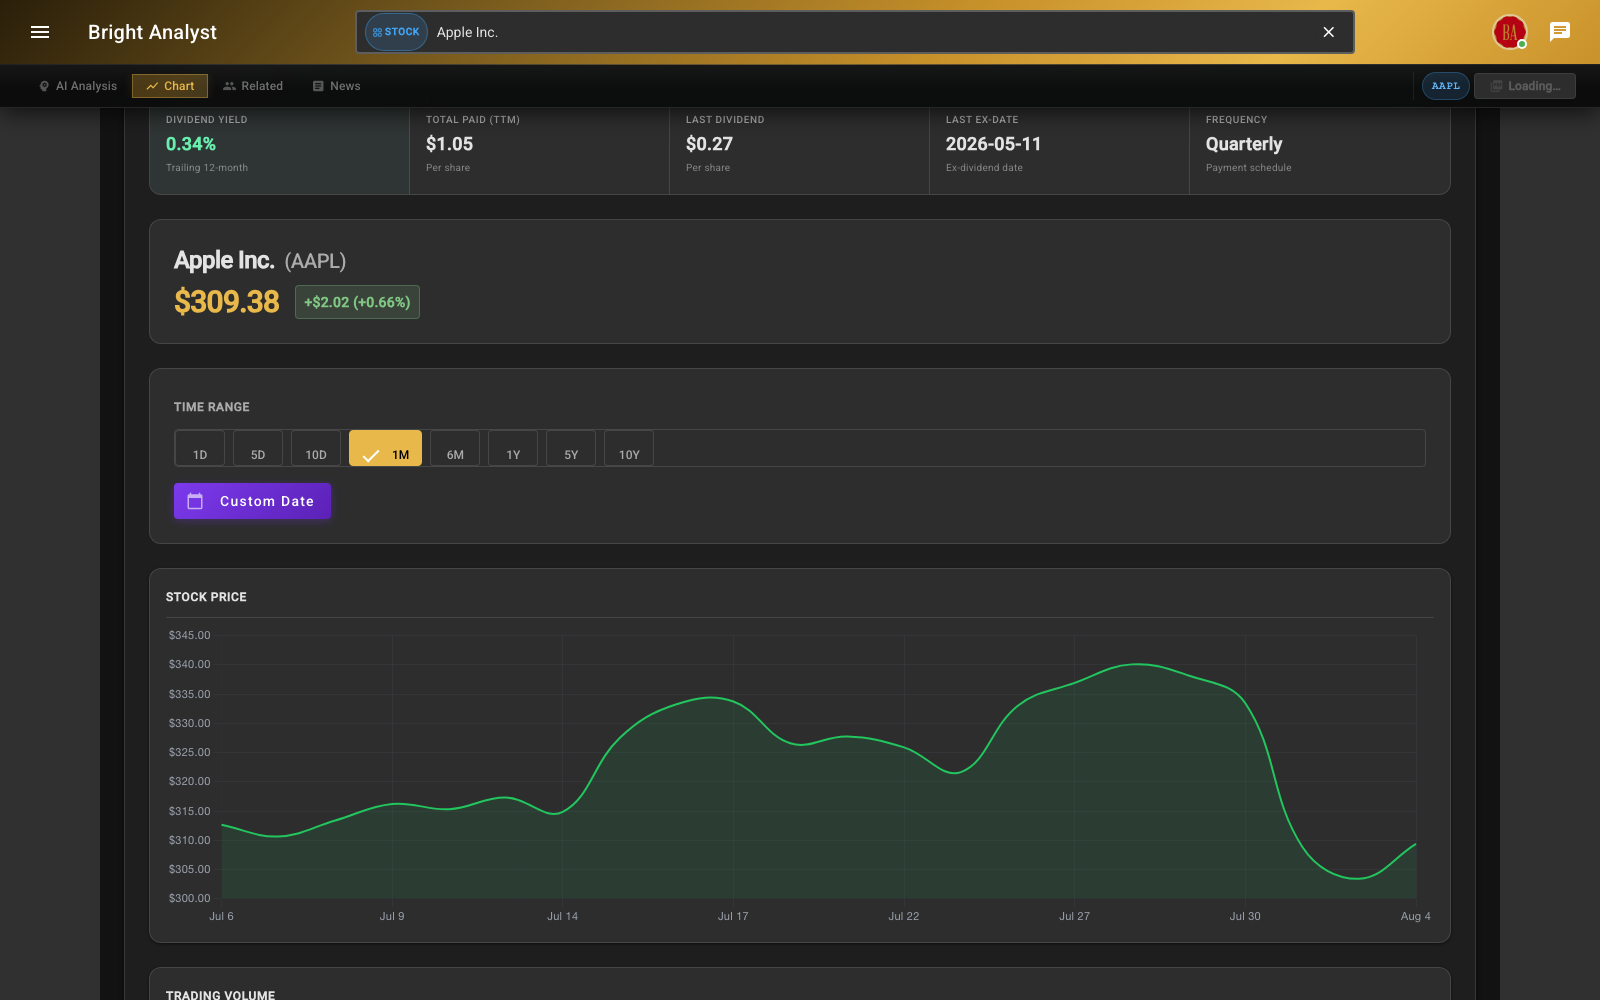
Interactive price charts with dividends, splits, and technicals built in.
This content is for informational purposes only and does not constitute investment advice. Past performance is not indicative of future results.
AAPL price history — Source: Bright Analyst, as of Aug 26, 2026
BRIGHT ANALYSTAAPL — largest historical drawdowns — Source: Bright Analyst, as of Aug 26, 2026
BRIGHT ANALYSTAAPL vs. SPY — hypothetical $100k — Source: Bright Analyst, as of Aug 26, 2026
BRIGHT ANALYST