A Comprehensive Financial Review of NVIDIA CORP
An in-depth look at historical income statements, balance sheets, and cash flows for NVIDIA CORP (NVDA) based on reported filings as of January 31, 2026.

Introduction to NVIDIA CORP
NVIDIA CORP (ticker: NVDA), operating within the semiconductors and related devices industry under SIC code 3674, is traded on The Nasdaq Global Select Market. This analysis reviews official financial filings to examine historical revenue growth, operational expenses, balance sheet composition, and cash flow generation.
Historical Revenue and Profitability Analysis
Reviewing the income statement highlights substantial shifts in financial scale over recent annual periods ending January 31. For the period ending January 31, 2026, reported Revenue reached $215.94B, compared to $60.92B for the period ending January 31, 2024, and $26.97B for the period ending January 31, 2023.
Correspondingly, Cost of revenue was recorded at $62.48B for the period ending January 31, 2026, down from previous periods when viewed alongside gross results, resulting in a Gross profit of $153.46B for the period ending January 31, 2026. This compares with $44.30B for the period ending January 31, 2024, and $15.36B for the period ending January 31, 2023.
Operating Expenses and Research Investments
Corporate expenditures play an essential role in sustaining technological development. For the fiscal period ending January 31, 2026, Research and development expenses reached $18.50B, scaling up from $8.68B for the period ending January 31, 2024, and $7.34B for the period ending January 31, 2023.
Meanwhile, Sales, general and administrative expenses stood at $4.58B for the period ending January 31, 2026, moving from $2.65B for the period ending January 31, 2024, and $2.44B for the period ending January 31, 2023. Combined, Total operating expenses were recorded at $23.08B for the period ending January 31, 2026, leading to an Income from operations of $130.39B.
Balance Sheet Strength and Asset Evolution
An examination of the balance sheet for the period ending January 31, 2026, details a robust asset foundation. Cash and cash equivalents stood at $10.61B, while Marketable securities were recorded at $51.95B. Total current assets reached $125.61B.
Longer-term figures for the period ending January 31, 2026, include Property and equipment, net at $10.38B and Total assets reaching $206.80B. On the liabilities side, Total current liabilities were reported at $32.16B, while Long-term debt stood at $7.47B, culminating in Total liabilities of $49.51B and Total shareholders' equity of $157.29B.
Cash Flow Dynamics and Capital Allocation
Operating cash generation remains a key metric for evaluating business health. For the period ending January 31, 2026, Net cash provided by operating activities reached $102.72B, an increase from $28.09B for the period ending January 31, 2024, and $5.64B for the period ending January 31, 2023.
Investing and financing activities reflect active capital deployment. Net cash provided by (used in) investing activities was -$52.23B for the period ending January 31, 2026, which included purchases of non-marketable equity securities of -$17.50B. Net cash provided by (used in) financing activities registered at -$48.47B, driven in part by payments related to repurchases of common stock totaling -$40.09B.
Key takeaways
- Revenue reached $215.94B for the annual period ending January 31, 2026.
- Gross profit expanded to $153.46B alongside operating income of $130.39B for the same period.
- Operating cash flow was recorded at $102.72B for the period ending January 31, 2026.
- Total assets grew to $206.80B with total shareholders' equity reaching $157.29B as of January 31, 2026.
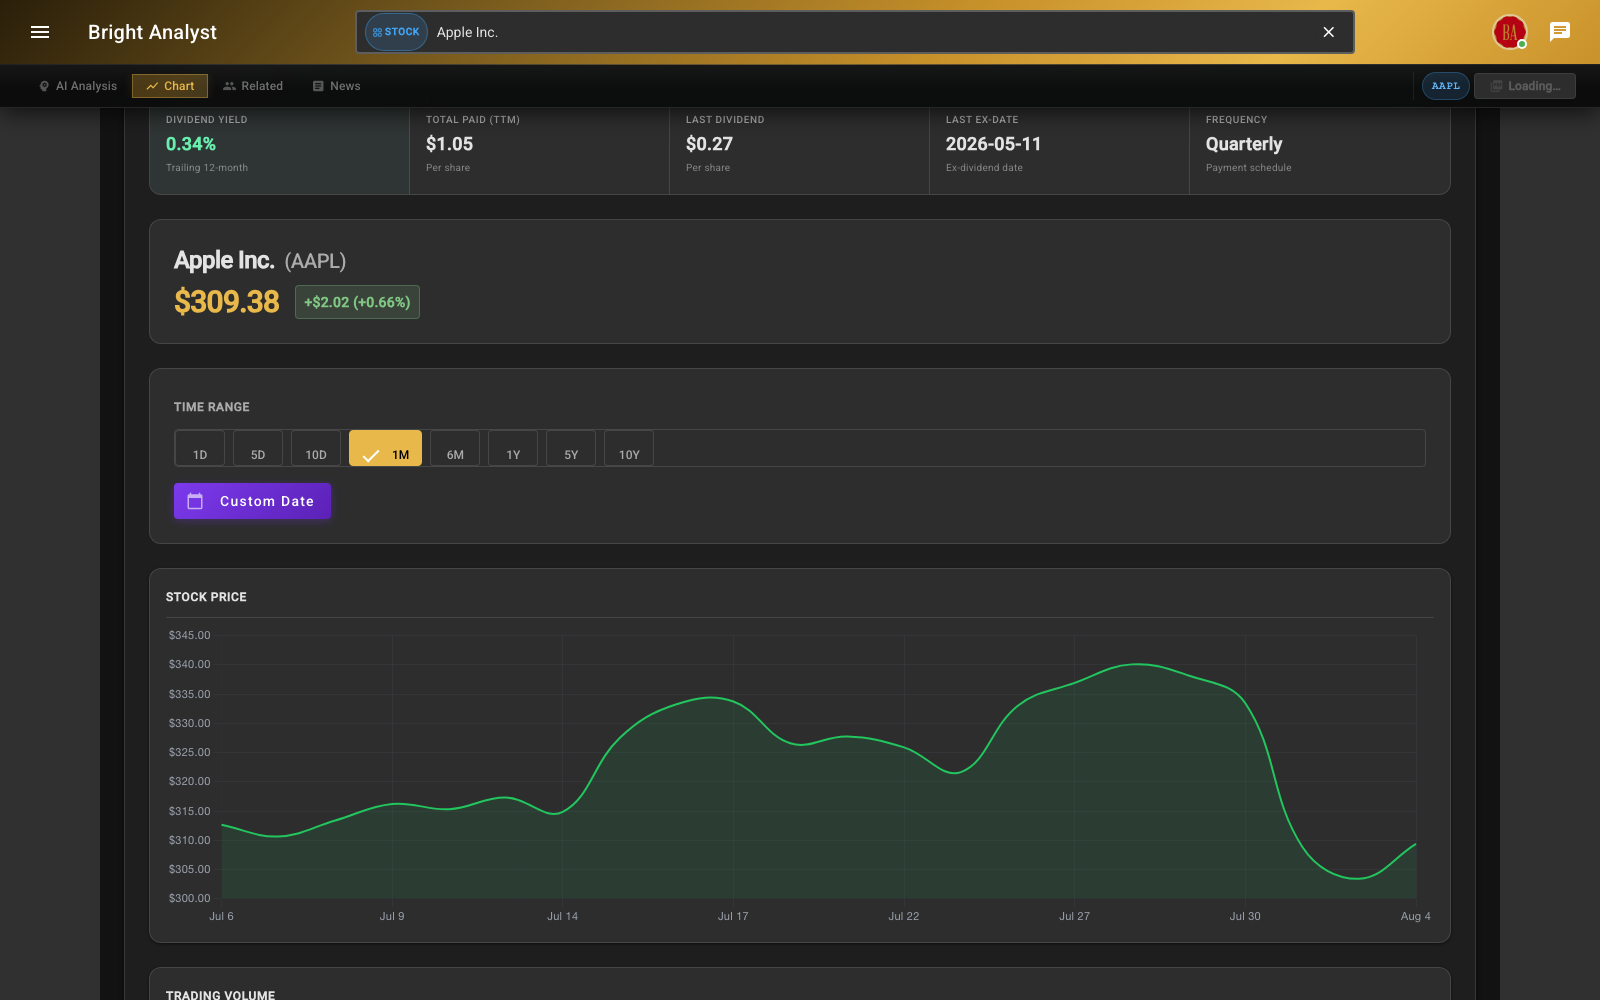
Interactive price charts with dividends, splits, and technicals built in.
See the live analysis on Bright Analyst →
This content is for informational purposes only and does not constitute investment advice. Past performance is not indicative of future results.